Tracing ✅
Kastrax supports the OpenTelemetry Protocol (OTLP) for tracing and monitoring your application. When telemetry is enabled, Kastrax automatically traces all core primitives including agent operations, LLM interactions, tool executions, integration calls, workflow runs, and database operations. Your telemetry data can then be exported to any OTEL collector.
Core Components
Kastrax’s tracing system is built on OpenTelemetry and consists of several core components:
- TracingSystem: The central entry point for tracing operations
- Tracer: Interface defining core tracing functionality
- TraceSpan: Interface representing a single trace span
- TracingConfig: Configuration for the tracing system
Basic Usage
Here’s a simple example of using the tracing system in Kotlin:
// Create tracing configuration
val config = TracingConfig().apply {
    serviceName = "my-service"
    samplingRate = 1.0  // Always sample
    exporters.otlp.enabled = true
    exporters.otlp.endpoint = "http://localhost:4318/v1/traces"
}

// Apply configuration and get tracer
val tracer = config.apply()

// Set global tracer
TracingSystem.setTracer(tracer)

// Create a span
val span = TracingSystem.createSpan("my-operation")
try {
    // Add attributes
    span.setAttribute("key", "value")

    // Perform operation
    // ...

    // Add event
    span.addEvent("operation-completed")

    // Set success status
    span.setSuccess()
} catch (e: Exception) {
    // Record exception
    span.setError("Operation failed")
    span.recordException(e)
    throw e
} finally {
    // End span
    span.end()
}
You can also use the simplified withSpan method:
val result = TracingSystem.withSpan<String>("my-operation") { span ->
    span.setAttribute("key", "value")
    // Perform operation and return result
    "operation result"
}
Configuration Options
The TracingConfig class provides numerous configuration options:
val config = TracingConfig().apply {
    // Service identification
    serviceName = "my-service"
    serviceVersion = "1.0.0"
    serviceNamespace = "kastrax"
    serviceInstanceId = "instance-1"

    // Sampling configuration
    samplingRate = 0.5  // Sample 50% of traces

    // Exporters configuration
    exporters.logging.enabled = true  // Console logging
    exporters.otlp.enabled = true     // OTLP exporter
    exporters.otlp.endpoint = "http://localhost:4318/v1/traces"
    exporters.otlp.headers = mapOf("x-api-key" to "your-api-key")

    // Context propagation
    propagation.w3c = true     // W3C trace context
    propagation.b3 = false     // B3 format
    propagation.jaeger = false // Jaeger format
}
JavaScript/TypeScript Configuration
For JavaScript/TypeScript applications, you can configure tracing as follows:
export const kastrax = new Kastrax({
  // ... other config
  telemetry: {
    serviceName: "my-app",
    enabled: true,
    sampling: {
      type: "always_on",
    },
    export: {
      type: "otlp",
      endpoint: "http://localhost:4318", // SigNoz local endpoint
    },
  },
});
The telemetry config accepts these properties:
type OtelConfig = {
  // Name to identify your service in traces (optional)
  serviceName?: string;

  // Enable/disable telemetry (defaults to true)
  enabled?: boolean;

  // Control how many traces are sampled
  sampling?: {
    type: "ratio" | "always_on" | "always_off" | "parent_based";
    probability?: number; // For ratio sampling
    root?: {
      probability: number; // For parent_based sampling
    };
  };

  // Where to send telemetry data
  export?: {
    type: "otlp" | "console";
    endpoint?: string;
    headers?: Record<string, string>;
  };
};
See the OtelConfig reference documentation for more details.
Environment Variables
You can configure the OTLP endpoint and headers through environment variables:
OTEL_EXPORTER_OTLP_ENDPOINT=http://localhost:4318
OTEL_EXPORTER_OTLP_HEADERS=x-api-key=your-api-key
Then in your config:
export const kastrax = new Kastrax({
  // ... other config
  telemetry: {
    serviceName: "my-app",
    enabled: true,
    export: {
      type: "otlp",
      // endpoint and headers will be picked up from env vars
    },
  },
});
Distributed Tracing
Kastrax supports distributed tracing across service boundaries:
// Extract context from incoming request
val extractedContext = tracer.extractContext(headers) { carrier, key ->
    carrier[key]
}

// Create a span with the extracted context
val span = tracer.createSpan("handle-request", parent = extractedContext)

// When making outgoing requests, inject context
val outgoingHeaders = mutableMapOf<String, String>()
tracer.injectContext(span.getContext(), outgoingHeaders) { carrier, key, value ->
    carrier[key] = value
}
Integration with Agents and Tools
Kastrax automatically integrates tracing with agents and tools:
// Create agent with tracing
val agent = agent {
    name("TracedAgent")
    description("Agent with tracing enabled")

    model = deepSeek {
        apiKey("your-api-key")
        model(DeepSeekModel.DEEPSEEK_CHAT)
    }

    // Enable tracing
    tracing {
        enabled = true
        level = TracingLevel.DETAILED
    }
}

// Create tool with tracing
val tool = tool("calculator") {
    description("Performs basic math calculations")

    // Enable tracing
    tracing {
        enabled = true
    }

    execute { params ->
        // Create span
        val span = TracingSystem.createSpan("calculator-execution")
        try {
            // Perform calculation
            // ...
            "Result: 42"
        } finally {
            span.end()
        }
    }
}
Workflow Tracing
Kastrax provides specialized tracing for workflows:
// Create workflow tracer
val tracer = DataFlowTracer()

// Execute workflow
val result = workflow.execute(input)

// Trace workflow execution
val traceResult = tracer.traceWorkflowExecution(workflow, context)

// Analyze trace results
traceResult.stepTraces.forEach { trace ->
    println("Step: ${trace.stepId}, Success: ${trace.success}")
}

// Trace specific variable
val variableTrace = tracer.traceVariable(workflow, "value", context)
Exporters
Kastrax supports multiple trace exporters:
- Logging Exporter: Outputs traces to the console
- OTLP Exporter: Sends traces to any OpenTelemetry collector
- Custom Exporters: Implement your own exporters for specific backends
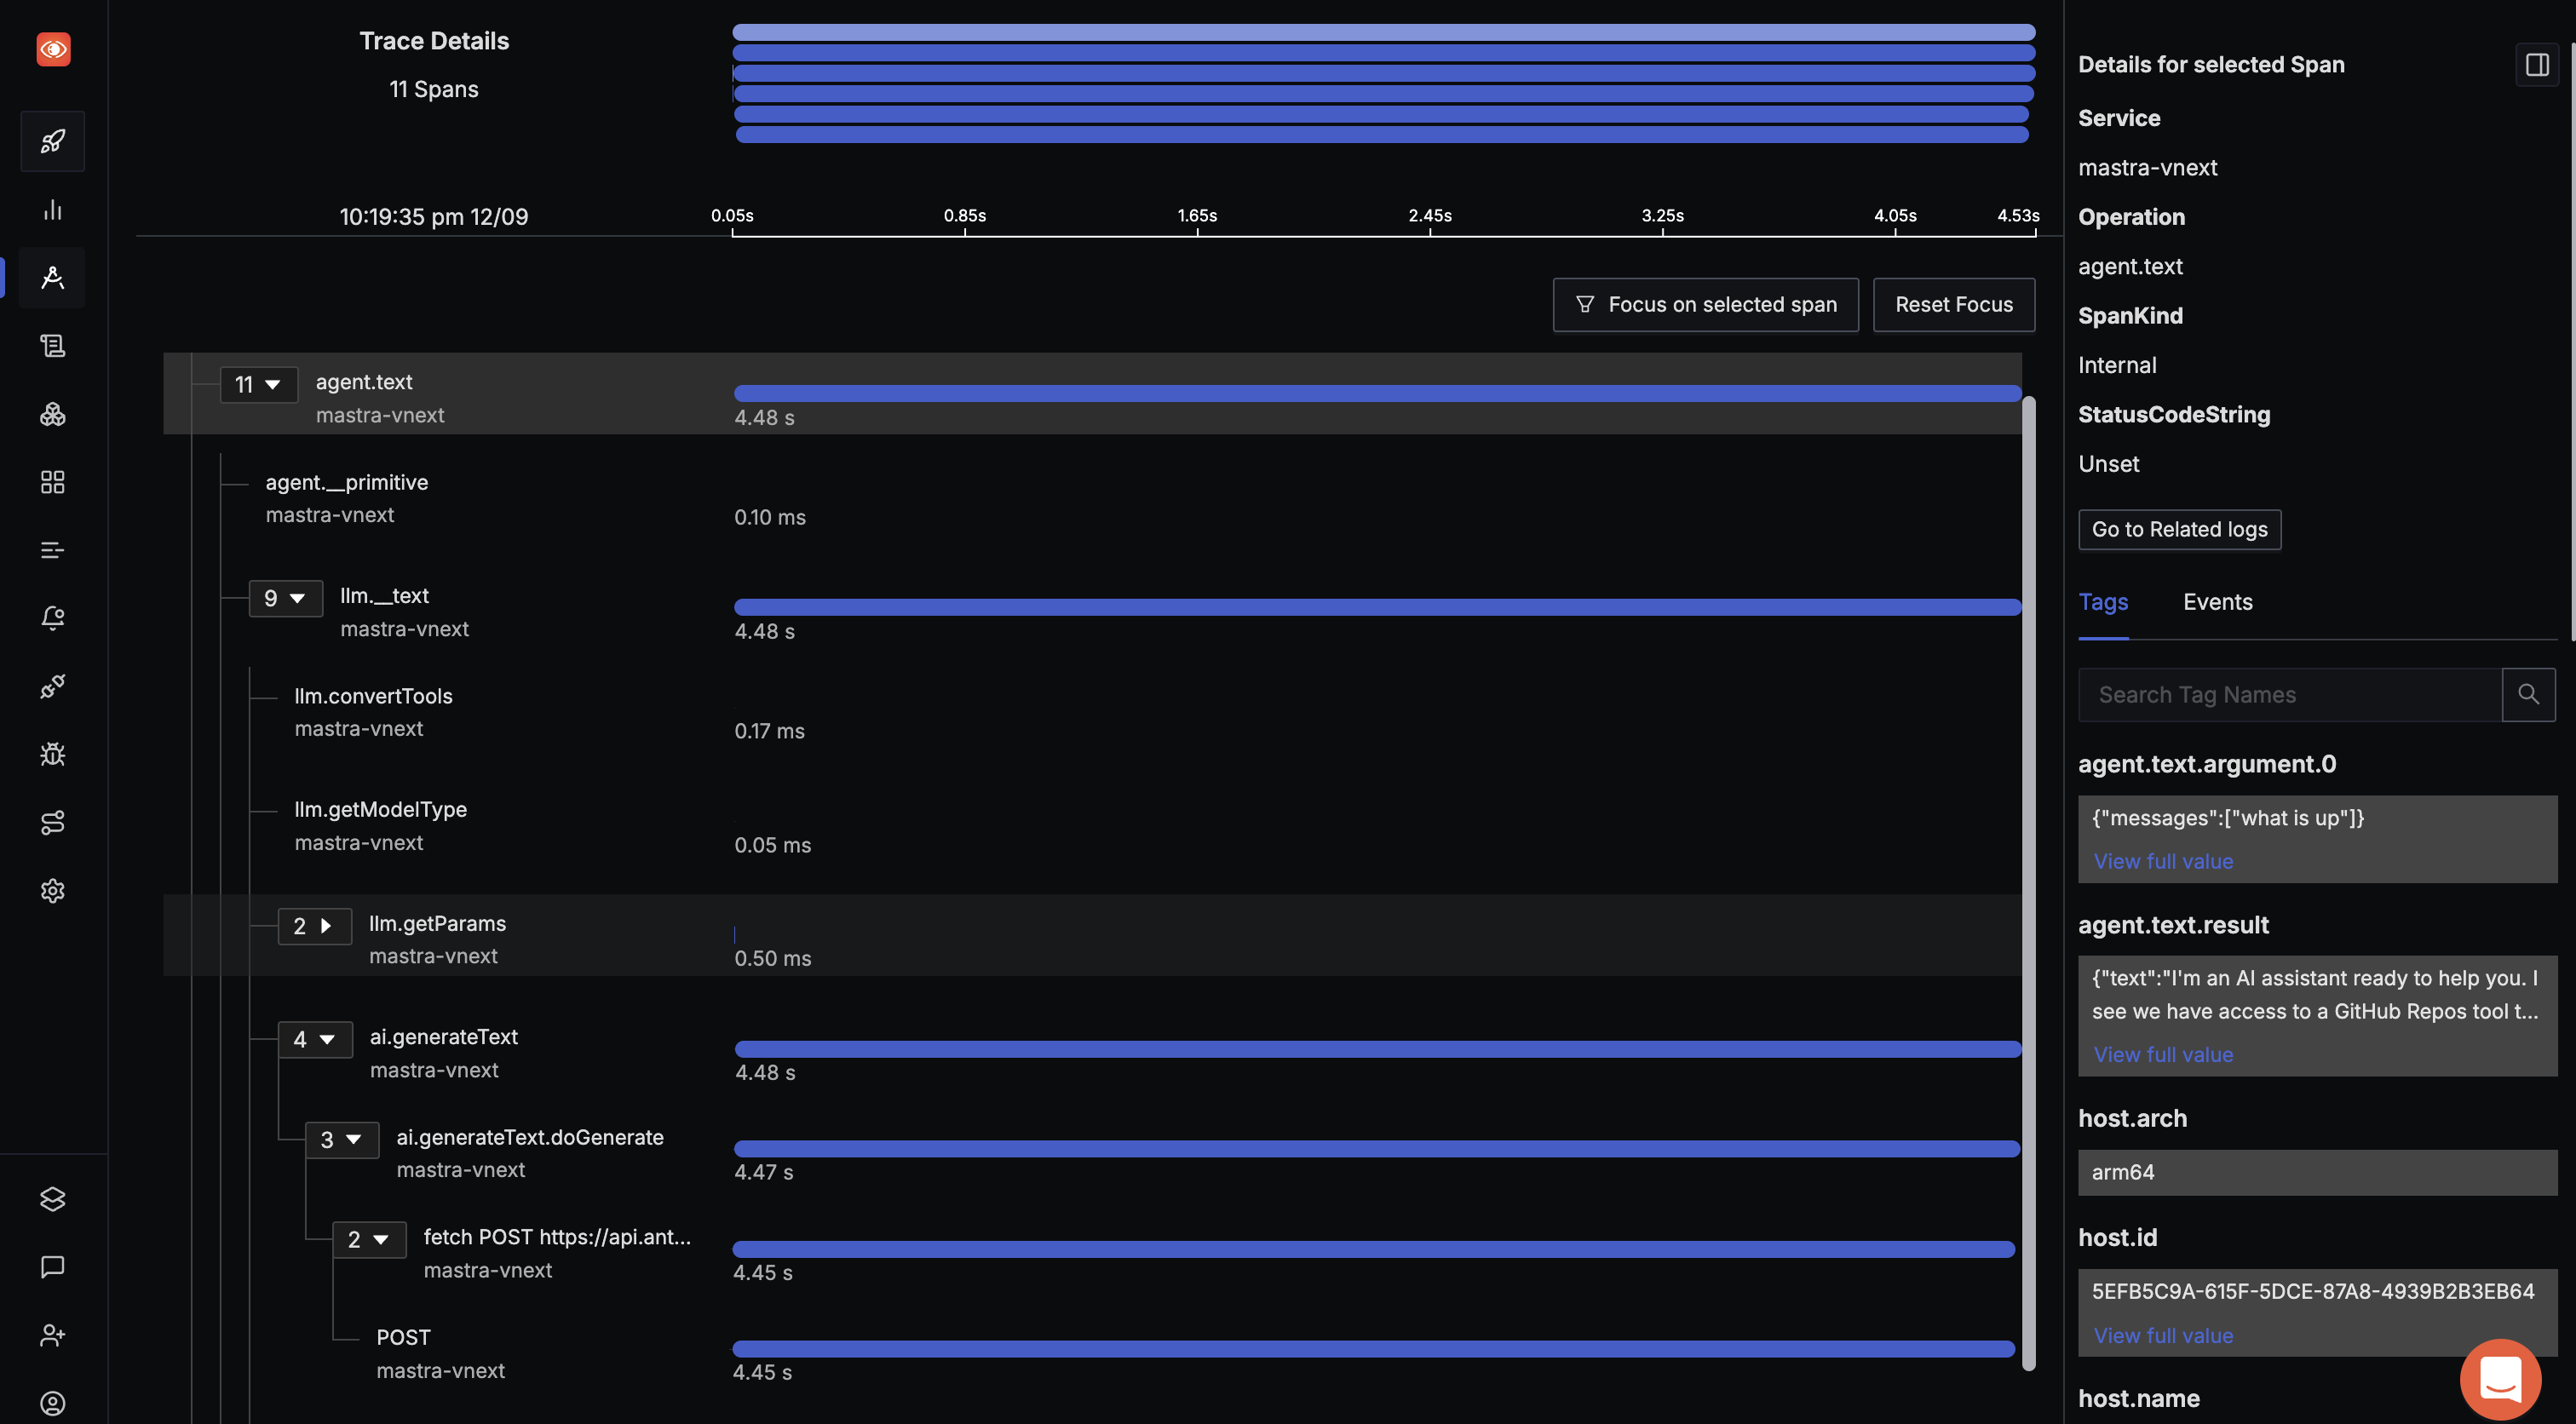
Example: SigNoz Integration
Here’s what a traced agent interaction looks like in SigNoz :
Other Supported Providers
For a complete list of supported observability providers and their configuration details, see the Observability Providers reference.
Best Practices
- Naming Conventions: Use consistent naming for spans
- Attribute Management: Add key attributes that help with diagnostics
- Error Handling: Always record exceptions and error states
- Performance Considerations: Use appropriate sampling rates to reduce overhead
- Context Propagation: Properly propagate context in distributed systems
- Sensitive Data: Avoid including sensitive information in spans
Next.js-specific Tracing steps
If you’re using Next.js, you have three additional configuration steps:
- Enable the instrumentation hook in
next.config.ts - Configure Kastrax telemetry settings
- Set up an OpenTelemetry exporter
For implementation details, see the Next.js Tracing guide.